Annual report 2022
Facts and figures
Bologna training
2022/2023 key figures for bachelor students
Bologna training l Number of students (2022-2023)
| Bachelor 1st year | Bachelor 2nd year | Bachelor 3rd year | Bachelor 4th year | Master 1st year | Master 2nd year | Total Bologna training | Bachelor degrees awarded in 2022 | Master degrees awarded in 2022 | |
|---|---|---|---|---|---|---|---|---|---|
| Full-time business economics |
74 |
44 | 36 | 154 | 54 | ||||
| Business economics in employment | 19 | 1 | 1 | 1 | 22 | 0 | |||
| Business economics in employment | 93 | 44 | 67 | 90 | 13 | 22 | 329 | 84 | 19 |
| Total HEG-FR | 186 | 89 | 104 | 91 | 13 | 22 | 505 | 138 | 19 |
(students as of 10.15.2022/graduates as of 12.31.2022)
Bachelor: evolution of the number of students
| Academic years | 2012 | 2013 | 2014 | 2015 | 2016 | 2017 | 2018 | 2019 | 2020 | 2021 | 2022 |
|---|---|---|---|---|---|---|---|---|---|---|---|
| Number of students | 478 | 465 | 563 | 510 | 598 | 612 | 608 | 587 | 561 | 504 | 470 |
Master: Evolution of the number of students
| Academic years | 2012 | 2013 | 2014 | 2015 | 2016 | 2017 | 2018 | 2019 | 2020 | 2021 | 2022 |
|---|---|---|---|---|---|---|---|---|---|---|---|
| Number of students | 64 | 78 | 77 | 73 | 63 | 53 | 56 | 49 | 53 | 47 | 35 |
Origin of bachelor and master students
| Provenance | Bachelor | Master | TOTAL |
|---|---|---|---|
| Fribourg | 314 | 4 | 318 |
| Berne | 24 | 1 | 25 |
| Genève | 5 | 4 | 9 |
| Jura | 6 | 0 | 6 |
| Neuchâtel | 3 | 0 | 3 |
| Tessin | 5 | 0 | 5 |
| Vaud | 85 | 14 | 99 |
| Valais | 19 | 2 | 21 |
| Autres cantons | 3 | 0 | 3 |
| Etrangers | 6 | 10 | 16 |
Distribution of Bachelor students 2022/2023
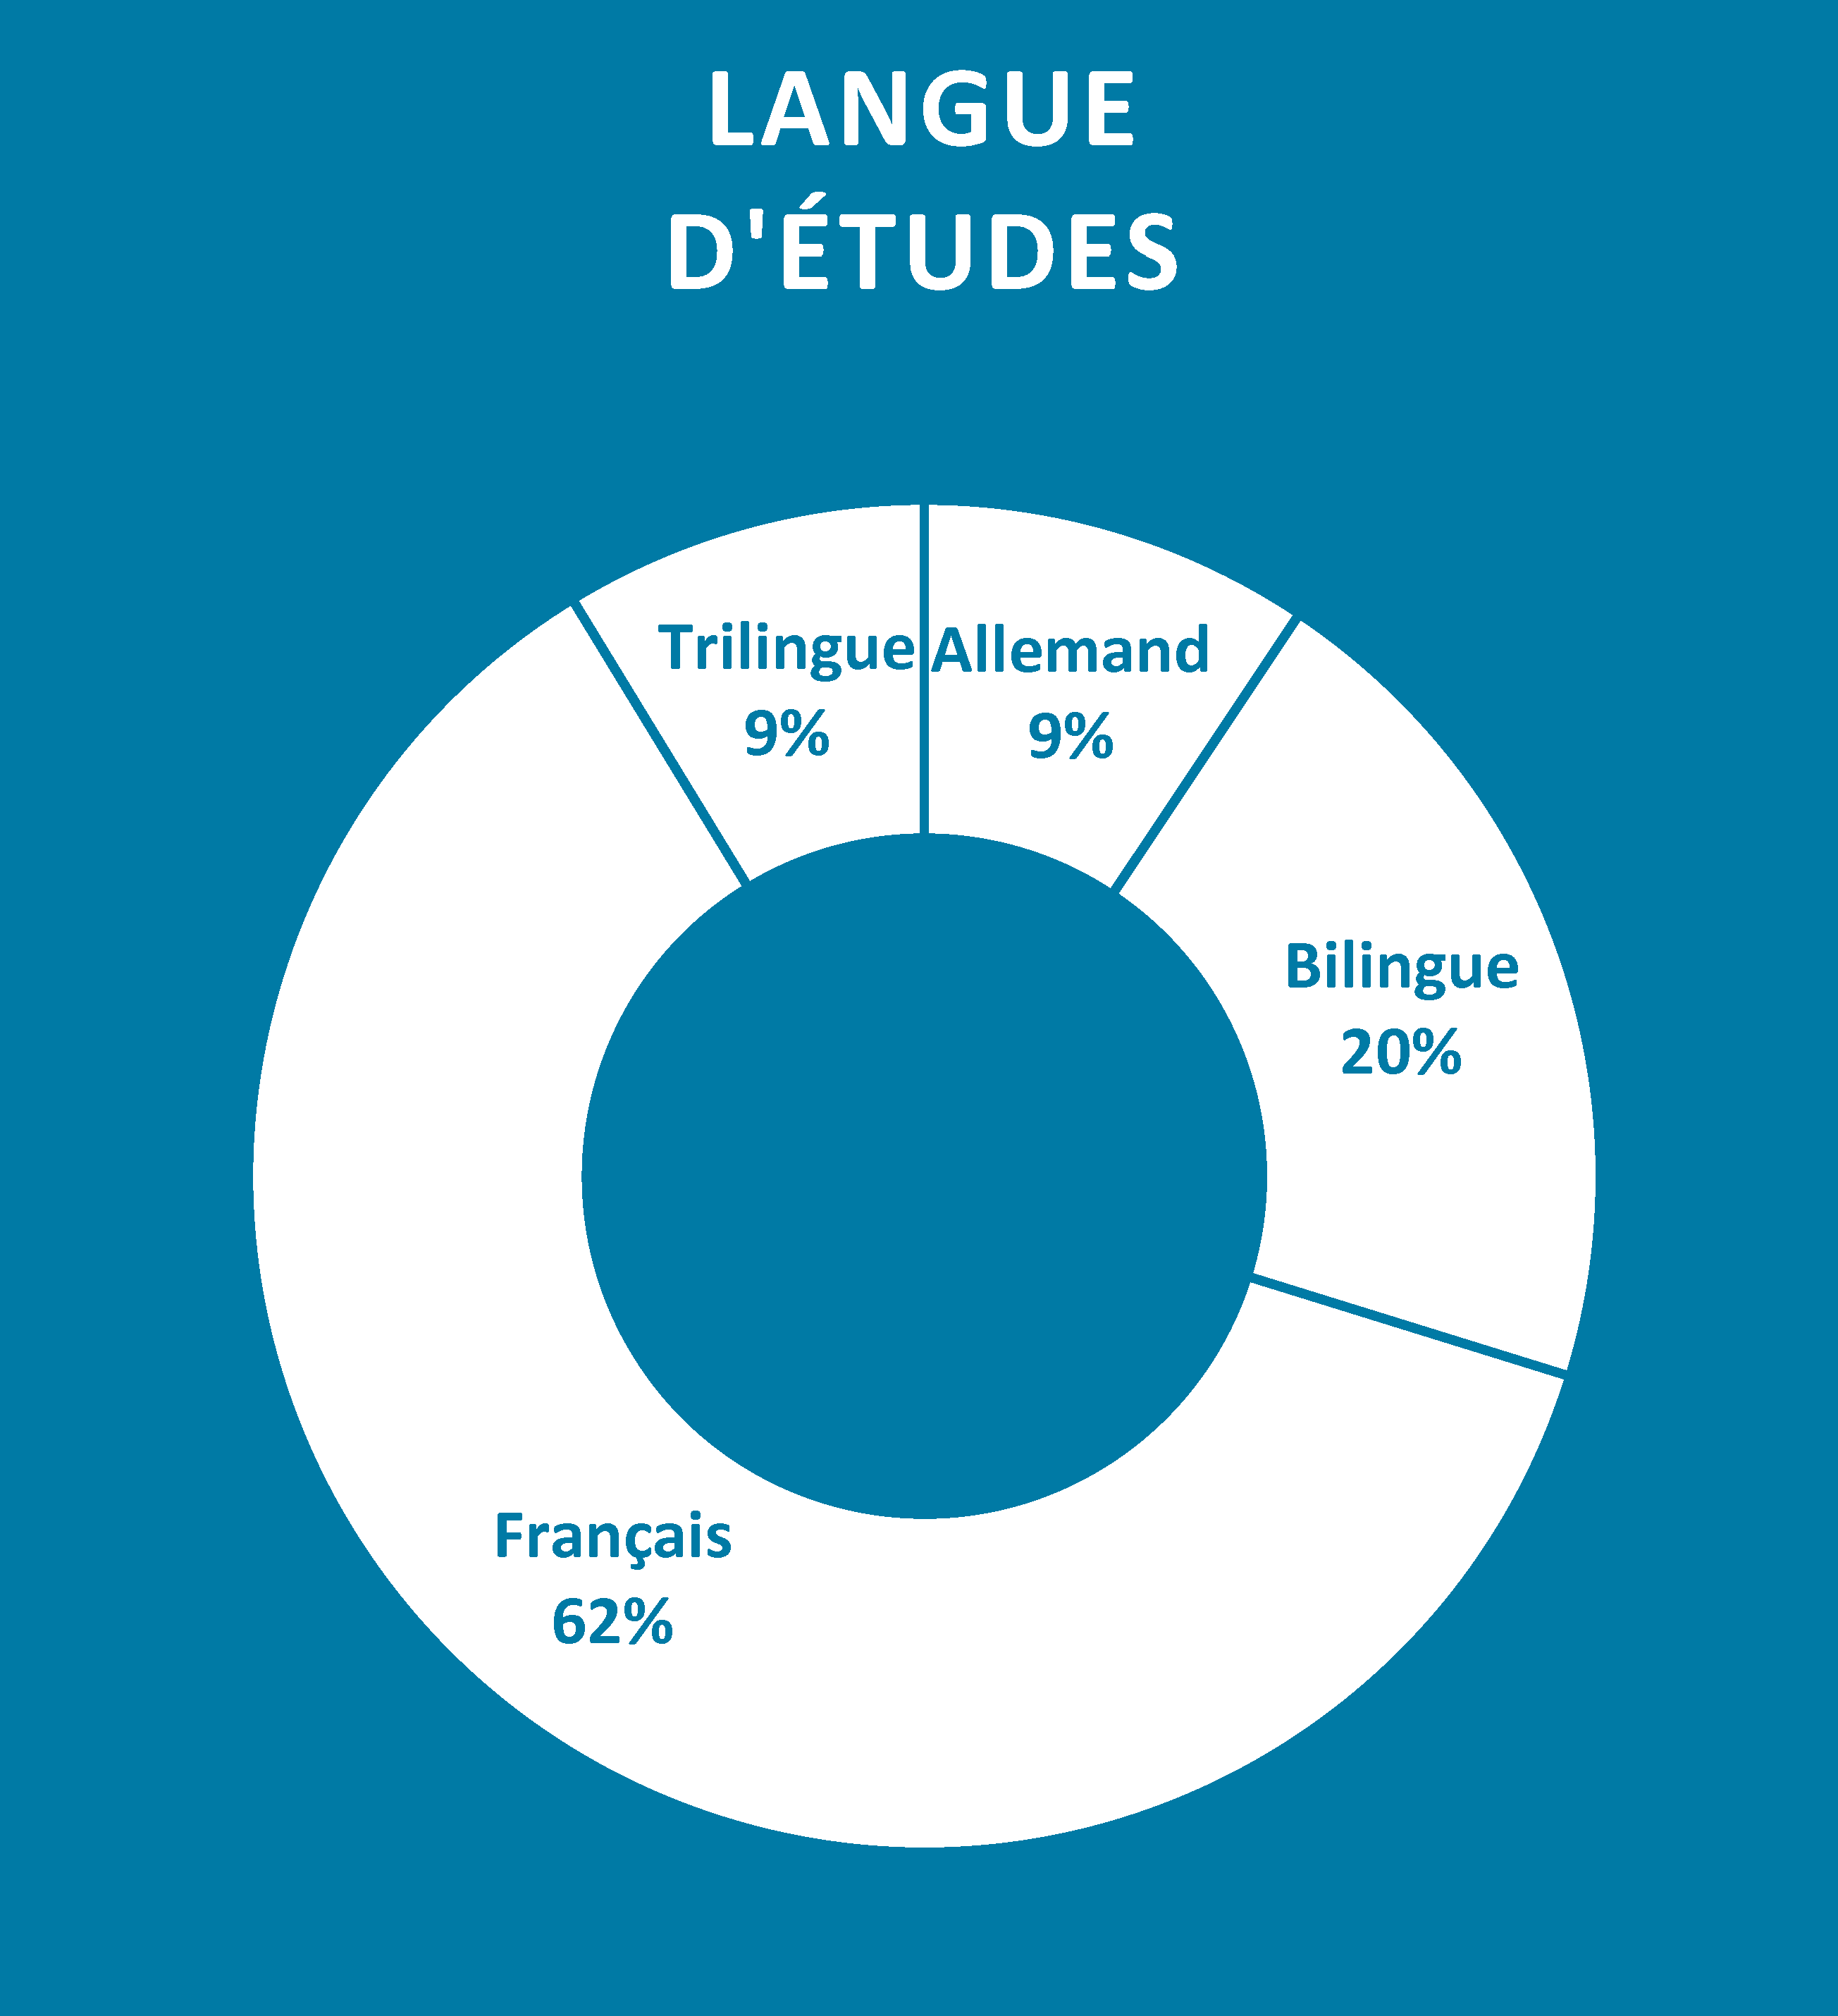
Language of study
| French | German | Bilingual | Trilingual |
|---|---|---|---|
| 62 % | 9 % | 20 % | 9 % |
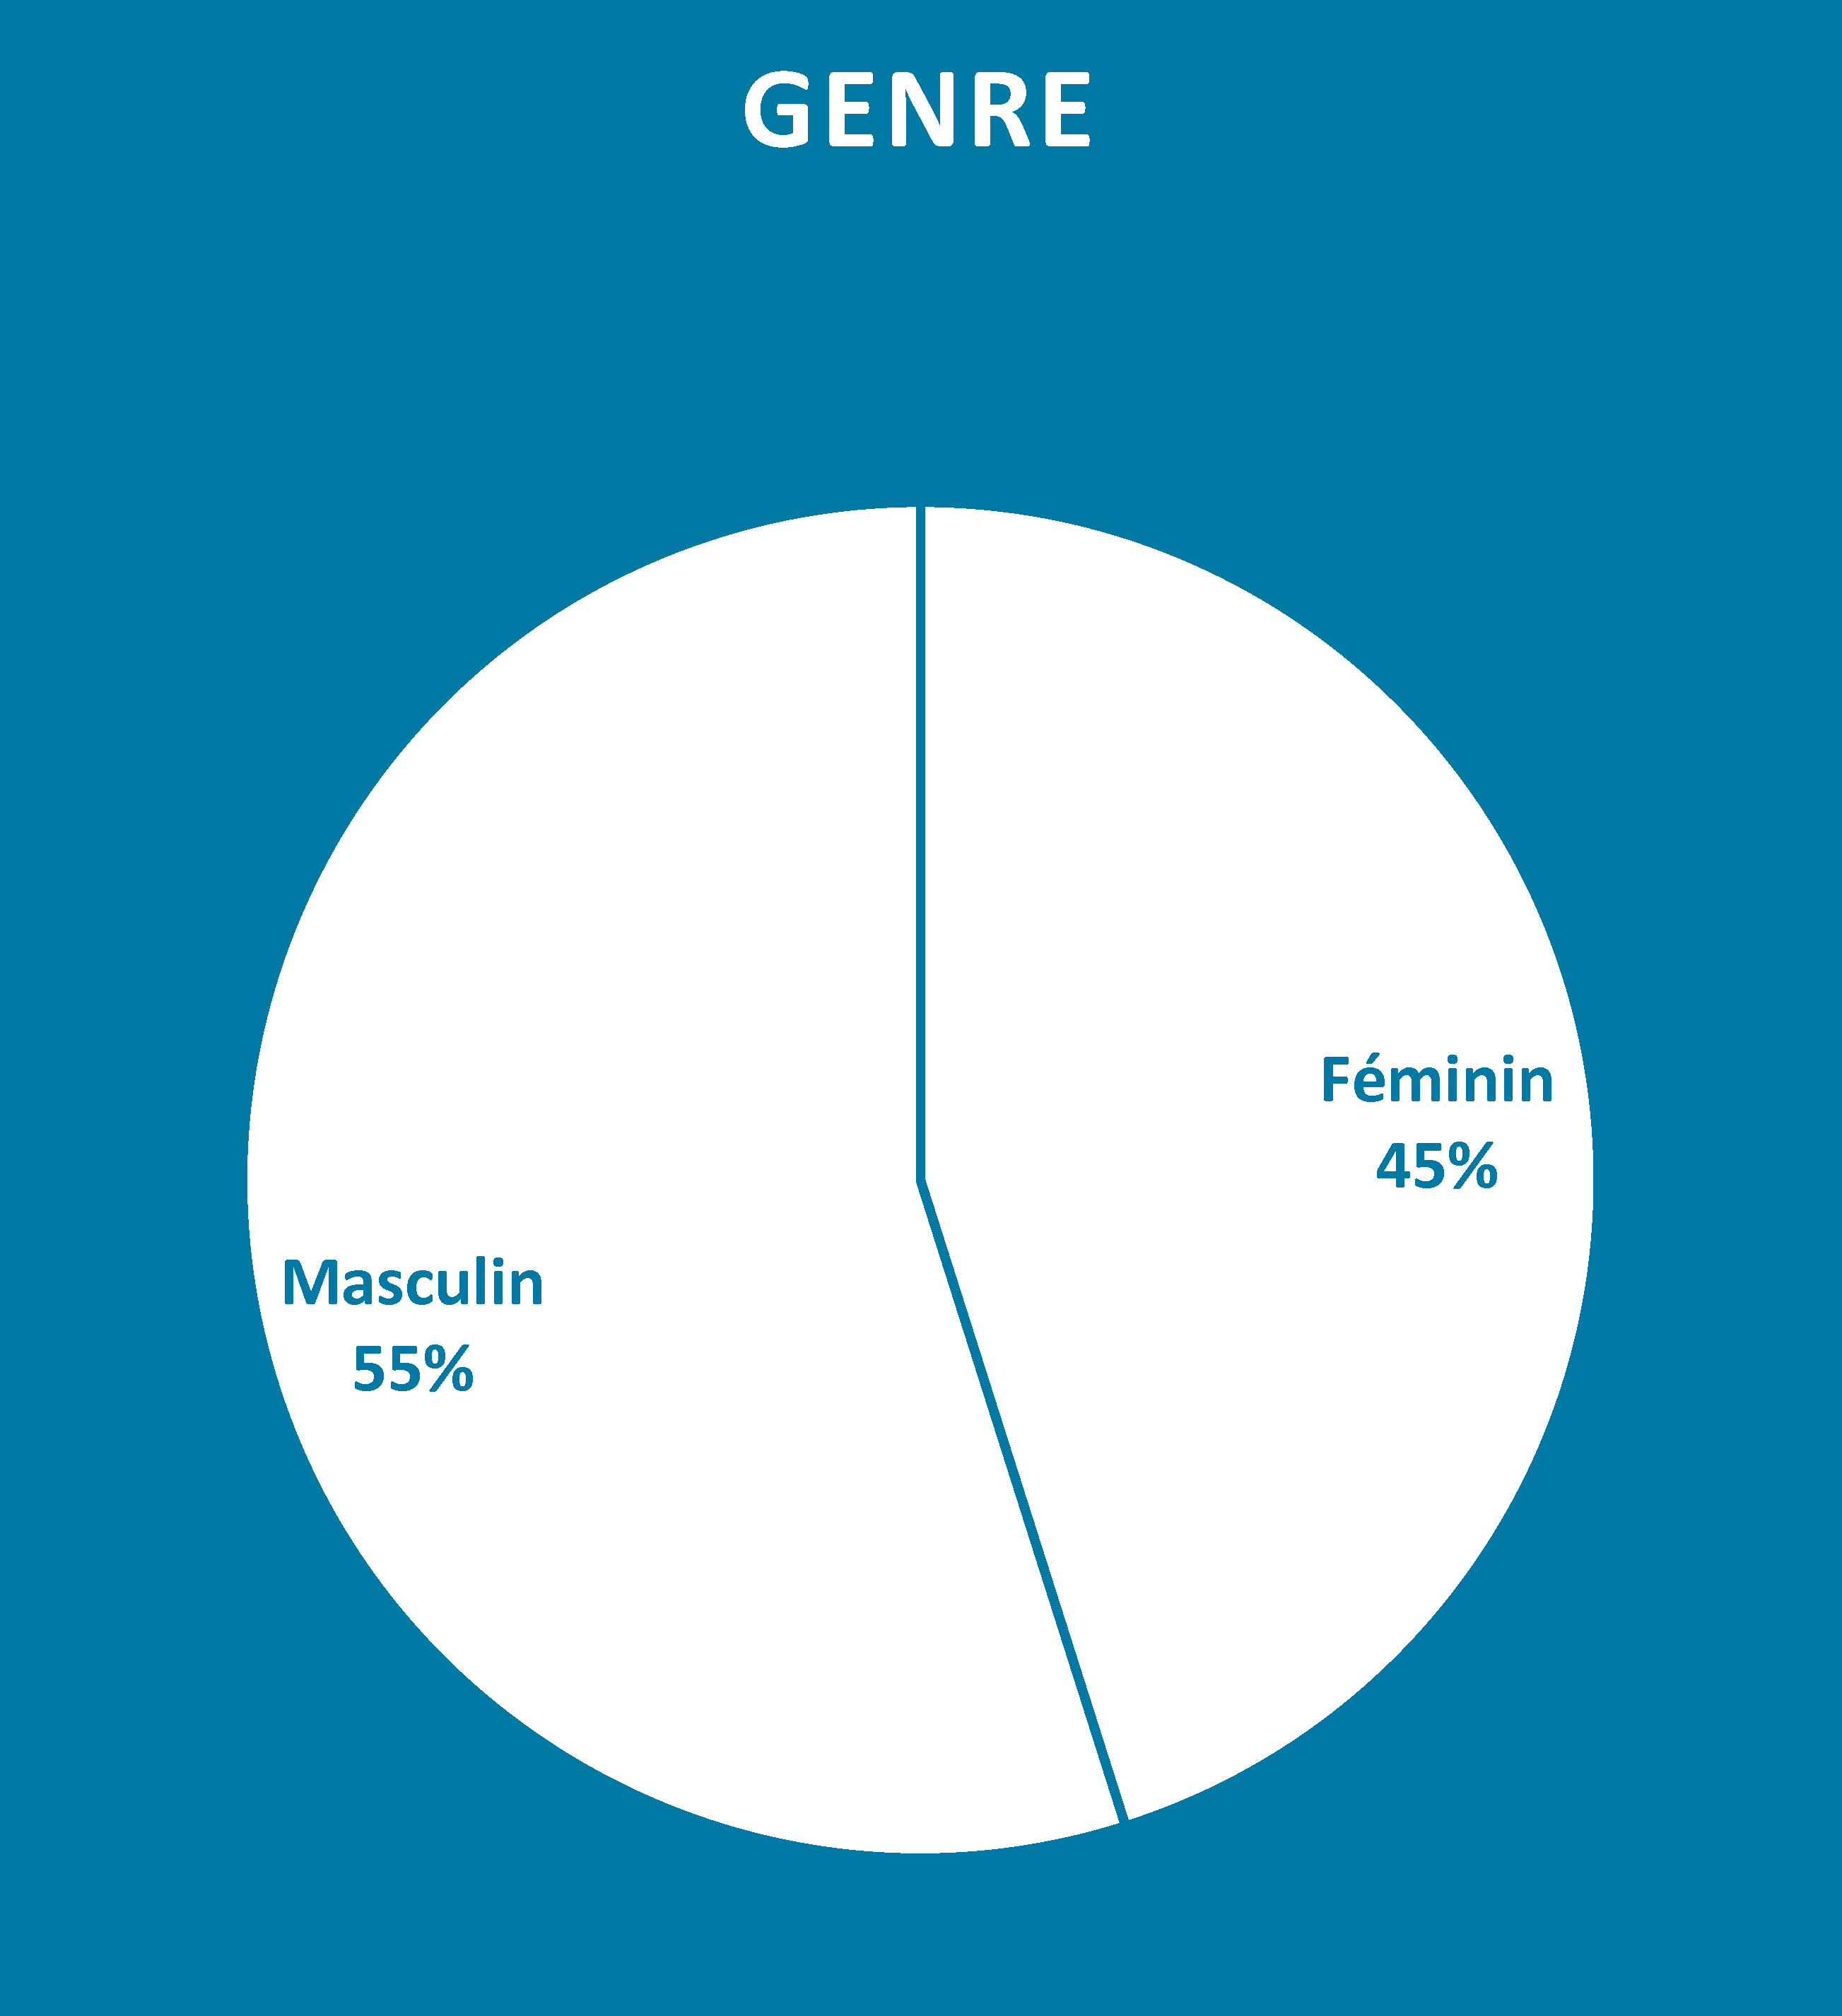
Gender
| Féminin | Masculin |
|---|---|
| 45 % | 55 % |
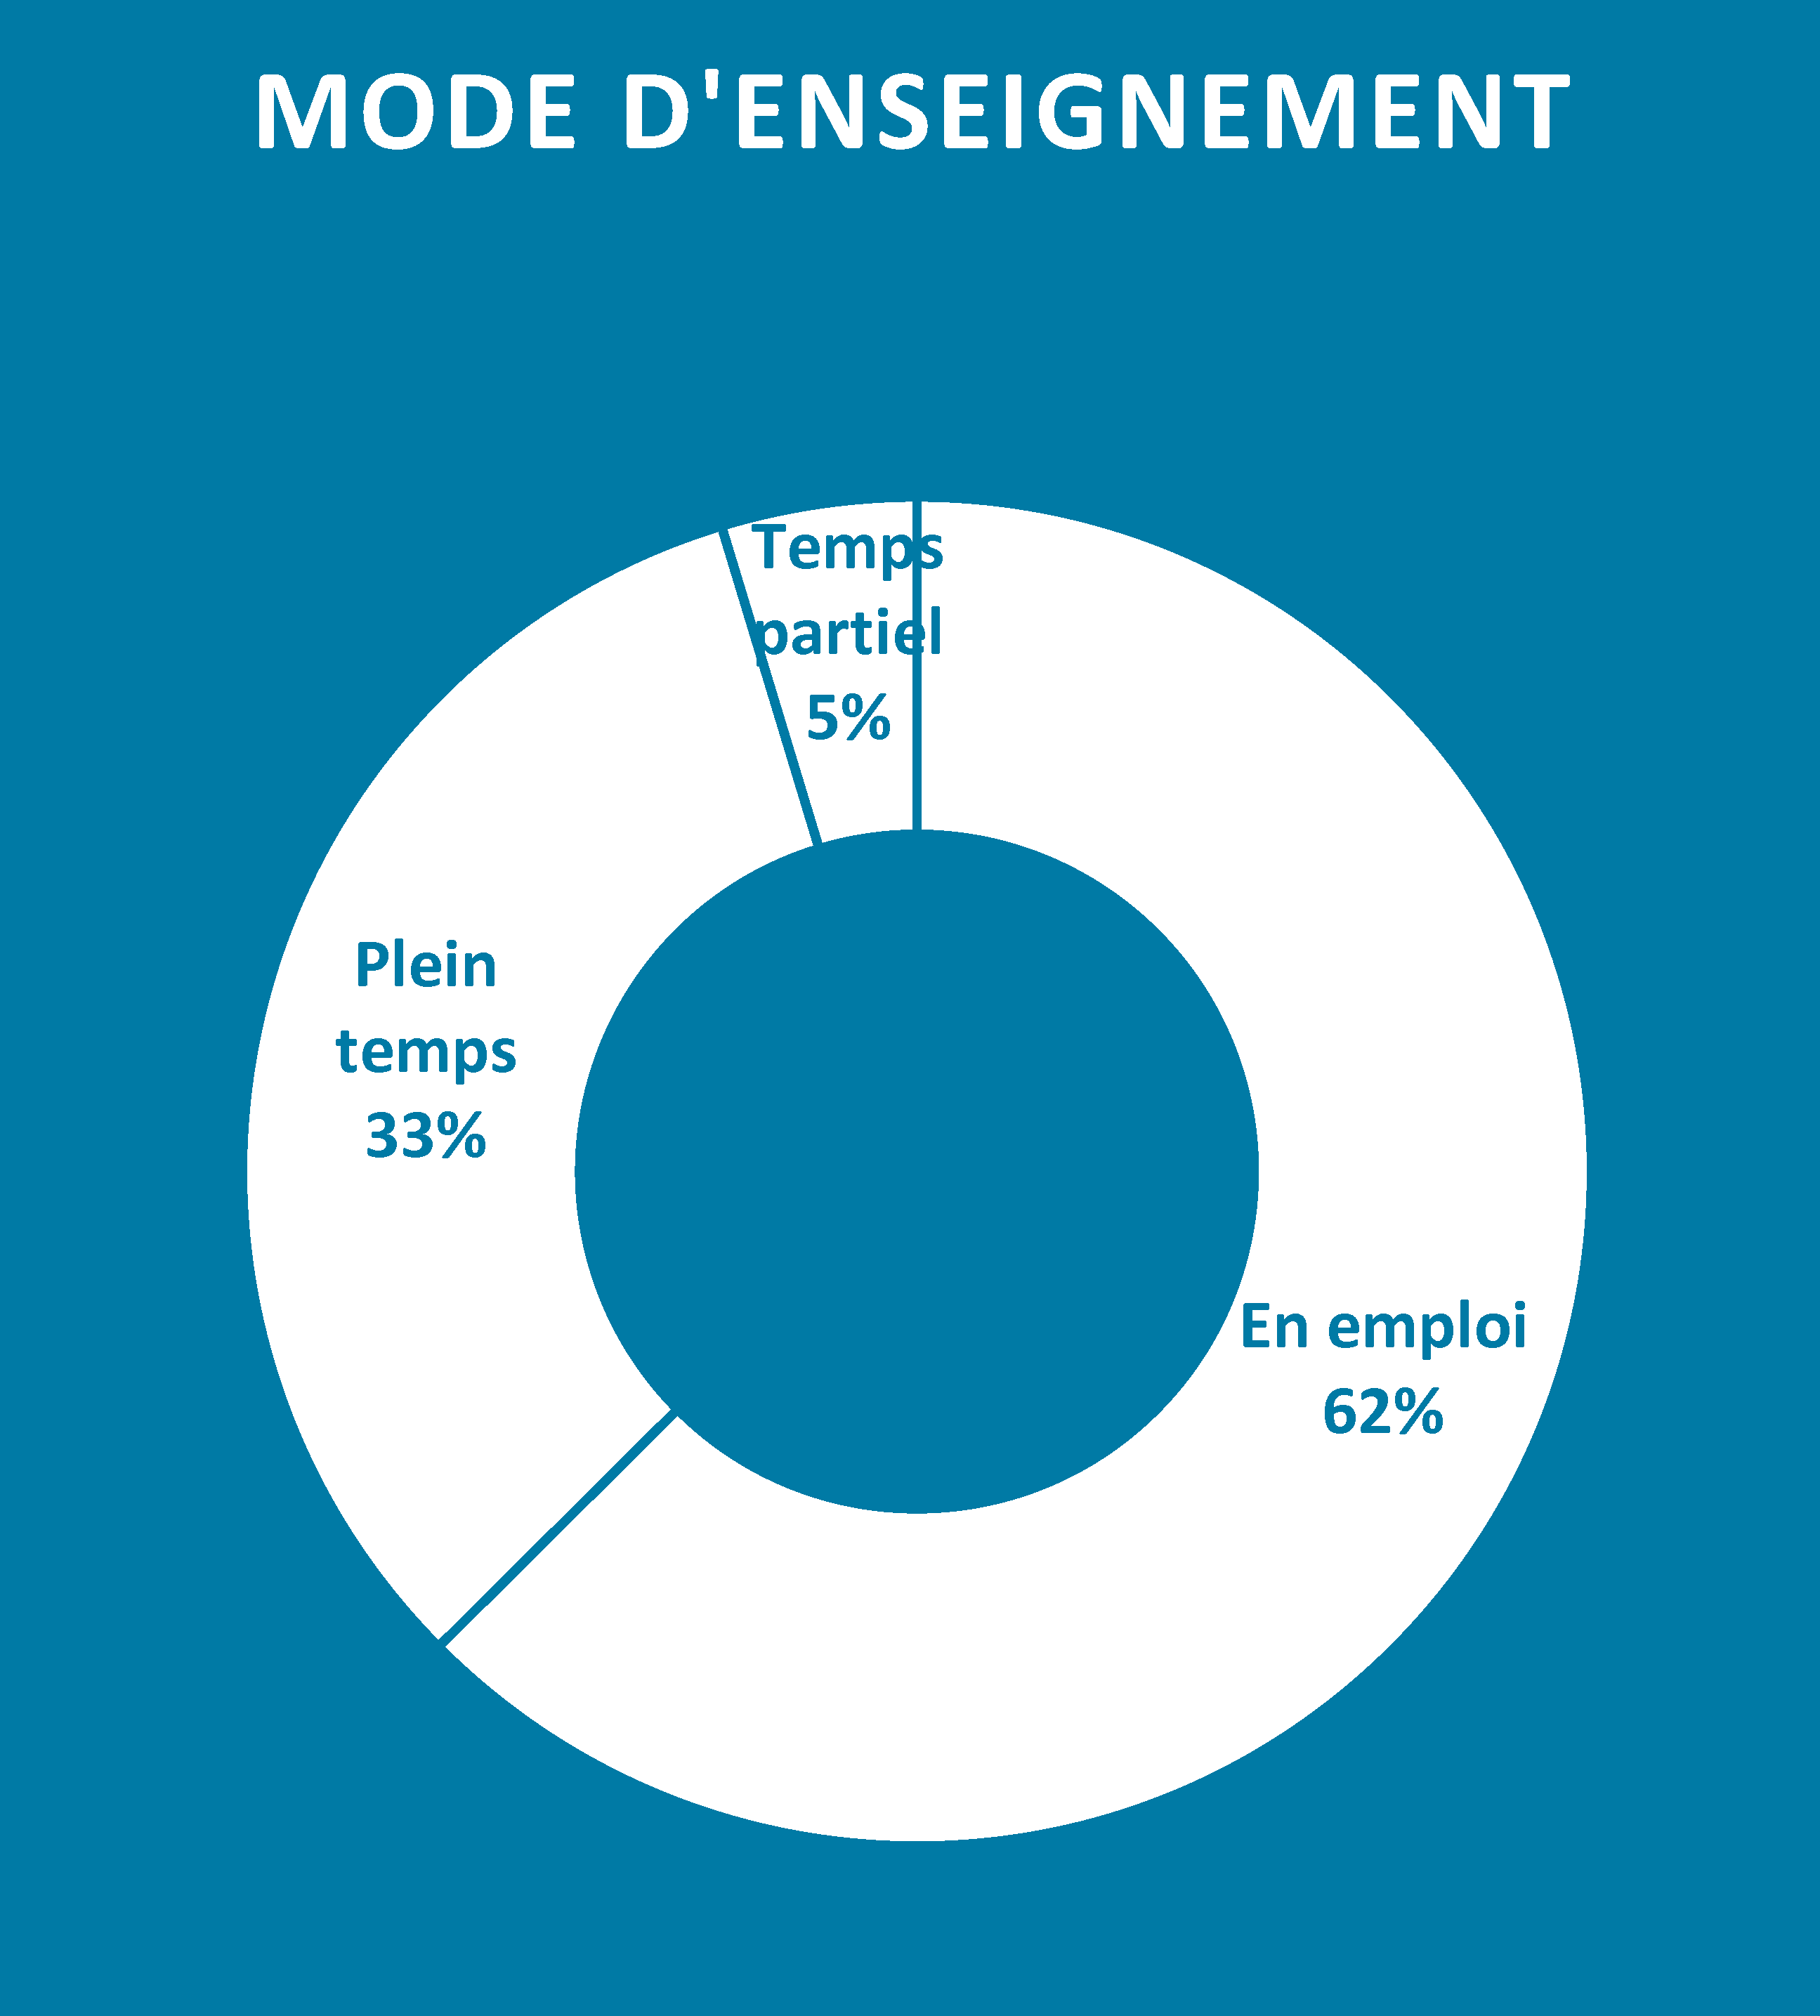
Teaching mode
| Employed | Full time | Part time |
|---|---|---|
| 62 % | 33 % | 5 % |
Distribution of Master students 2022/2023
Gender
| Female | Male |
|---|---|
| 51 % | 49 % |
Continuing training l Evolution of the number of students
EMBA
| Années | 2012-2013 | 2013-2015 | 2014-2016 | 2015-2017 | 2016-2018 | 2017-2019 | 2018-2020 | 2019-2021 | 2020-2022 | 2021-2022 | 2022-2023 |
|---|---|---|---|---|---|---|---|---|---|---|---|
| Number of participants | 16 | 16 | 12 | 18 | 15 | 12 | 11 | 11 | - | 10 | 11 |
DAS
| Années | 2017 | 2018 | 2019 | 2020 | 2021 | 2022 |
|---|---|---|---|---|---|---|
| Management de la communication | 52 | 32 | 10 | 15 | 13 | 16 |
CAS
| Années | 2012-2013 | 2013-2014 | 2014-2015 | 2015-2016 | 2016-2017 | 2017-2018 | 2018-2019 | 2019-2020 | 2020-2021 | 2021-2022 | 2022-2023 |
|---|---|---|---|---|---|---|---|---|---|---|---|
| Gestion d'entreprise | 15 | 11 | 25 | 19 | 18 | 34 | 17 | 19 | 20 | 22 | 19 |
| Gestion de projet | 12 | 10 | 13 | 7 | 12 | 8 | 12 | 12 | 15 | 16 | 16 |
| Public management | 14 | 19 | 18 | 19 | 20 | 20 | 20 | 20 | 19 | 16 | 18 |
| Supply Chain Management | - | 8 | - | 11 | - | 8 | 6 | 11 | 9 | 11 | - |
| Rédaction stratégique | - | - | - | 20 | 12 | 12 | 11 | 9 | 17 | 15 | - |
| Compensation & Benefits Management (FR) | - | - | - | - | - | - | 7 | 15 | - | 7 | 11 |
| Compensation & Benefits Management (DE) | - | - | - | - | - | - | 11 | 14 | 11 | 14 | 6 |
| Entrepreneuriat social | - | - | - | - | - | - | - | 11 | - | 12 | - |
| Création et Gestion de contenus numériques | - | - | - | - | - | - | - | - | 6 | 8 | 6 |
(figures as of 15.10.2022)
State continuing education
| Années | 2012 | 2013 | 2014 | 2015 | 2016 | 2017 | 2018 | 2019 | 2020 | 2021 | 2022 |
|---|---|---|---|---|---|---|---|---|---|---|---|
| Number of participants | 1190 | 1108 | 1110 | 1306 | 1170 | 1391 | 1252 | 1281 | 948 | 1320 | 1370 |
(figures as of 31.12.2022)

Personnel statistics
| HEG-FR staff | EPT 2022 | EPT 2021 | EPT 2020 | EPT 2019 | EPT 2018 | EPT 2017 | EPT 2016 |
|---|---|---|---|---|---|---|---|
| Administrative and technical staff | 15.4 | 14.6 | 12 | 12.41 | 10.02 | 11.9 | |
| Teaching staff | 44.4 | 45.5 | 45.9 | 41.07 | 41.17 | 38.6 |
(all figures as of 15.10.2022)